COVID-19 Data Visualization in R
Li Wang
6/22/2022
Goal
My goal with this project is to create a vignette about contacting the [COVID19 API] (https://documenter.getpostman.com/view/10808728/SzS8rjbc) using functions I create to query, parse, return well-structured data, and then I will use the functions to obtain data from the API and do some exploratory data analysis.
Load Packages
To use the functions for interacting with the COVID19 API, I used the following packages:
library(httr)
library(jsonlite)
library(readr)
library(dplyr)
library(plyr)
library(tidyr)
library(ggplot2)
library(tidyverse)
library(lubridate)
Write functions to query the data
“By Country” endpoint
I write this function to interact with the “By Country” endpoint of the COVID19 API.
The following function can allow us to query the “country”,”status”, “from”, and “to” modifications to return a specific data. The status must be one of: confirmed, recovered, deaths.
# write a funtion to query the "country","status", "from", and "to" modifications to return a specific data.
covid19_data_by_country<- function(country,status,from,to){
  base<-"https://api.covid19api.com/country/"
  call1 <- paste(base,country,"/","status","/",status,"?","from","=",from, "&","to","=",to, sep="")
  by_country <- GET(call1)
  by_country_text <- content(by_country, "text")
  by_country_json <- fromJSON(by_country_text, flatten = TRUE)
  # Remove the column 4 to 5 which is non-meaningful
  covid19_by_country <- by_country_json[,-(4:5),drop=FALSE]
}
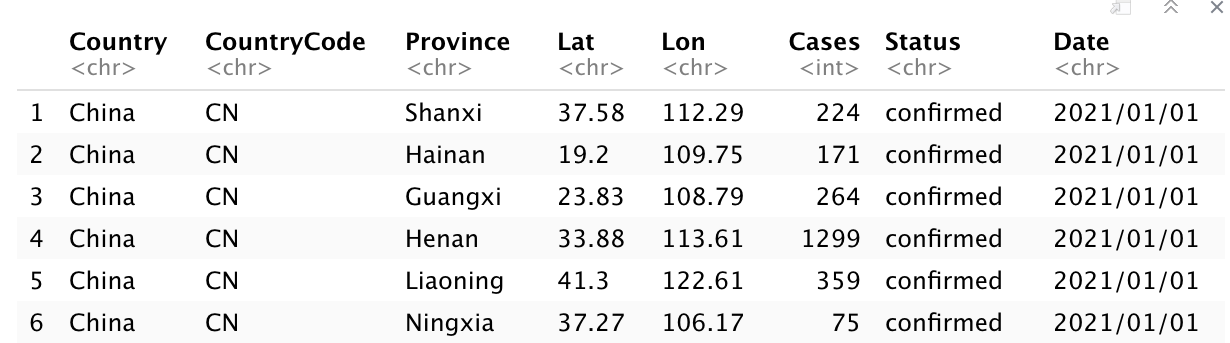
I query the “country” as “China”, the “status” as “confirmed”, the “from” as “2021/01/01”, and “to” as “2021/12/31”, then I got the data set of the COVID19 confirmed cases for china from “2021/01/01” to”2021/12/31”.
# Query the data set "china_confirmed" with the COVID19 confirmed cases for china from "2021/01/01" to"2021/12/31".
china_confirmed <-covid19_data_by_country("china","confirmed","2021/01/01","2021/12/31")
# change the Date to ""%Y/%m/%d""
china_confirmed$Date <- format(as.POSIXct(china_confirmed$Date,format="%Y-%m-%dT%H:%M:%SZ"),format="%Y/%m/%d")
head(china_confirmed)
“By Country Total” endpoint
I write this function to interact with the “By Country Total” endpoint of the COVID19 API.
The following function can allow us to query the “country”, “status”, “from”, and “to” modifications to return a specific data. The status must be one of: confirmed, recovered, deaths.
# write a function to query the "country","status", "from", and "to" modifications to return a specific data.
covid19_Country_Total<- function(country,status,from,to){
  base<-"https://api.covid19api.com/total/country/"
  call2 <- paste(base,country,"/","status","/",status,"?","from","=",from, "&","to","=",to, sep="")
  country_total <- GET(call2)
  country_total_text <- content(country_total, "text")
  country_total_json <- fromJSON(country_total_text, flatten = TRUE)
  # Remove the column 2 to 7 which is non-meaningful.
  country_total_data <- country_total_json[,-(2:7)]
}
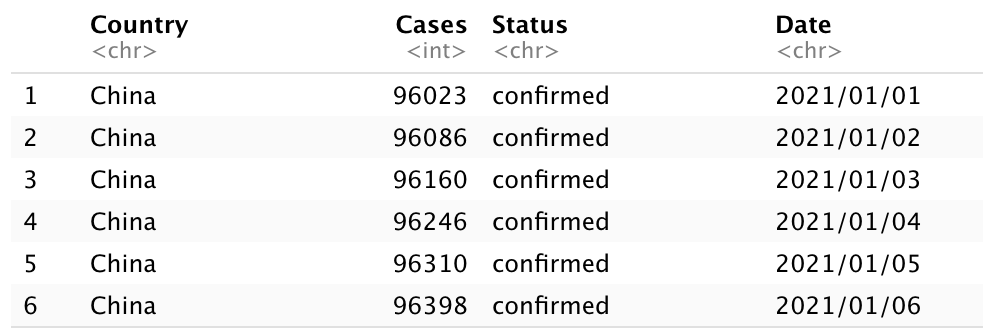
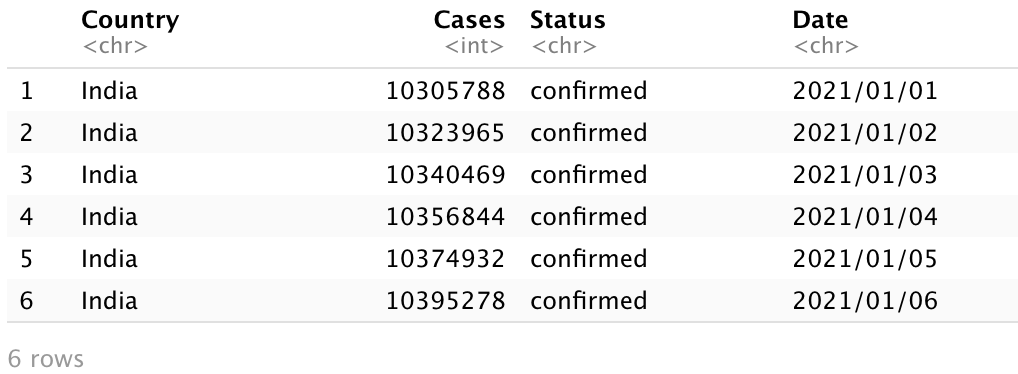
I query the “country” as “China”and “India”, the “status” as “Confirmed”and”deaths”, the “from” as “2021/01/01”, and “to” as “2021/12/31”, and return the COVID19 confirmed and deaths cases for China and India from 2021/01/01 to 2021/12/31.
# Query the data set "china_Total" with the total COVID19 confirmed cases for China from 2021/01/01 to 2021/12/31
china_Total <-covid19_Country_Total("China","confirmed","2021/01/01","2021/12/31")
# Query the data set "India_Total" with the total COVID19 confirmed cases for India from 2021/01/01 to 2021/12/31
India_Total <-covid19_Country_Total("India","confirmed","2021/01/01","2021/12/31")
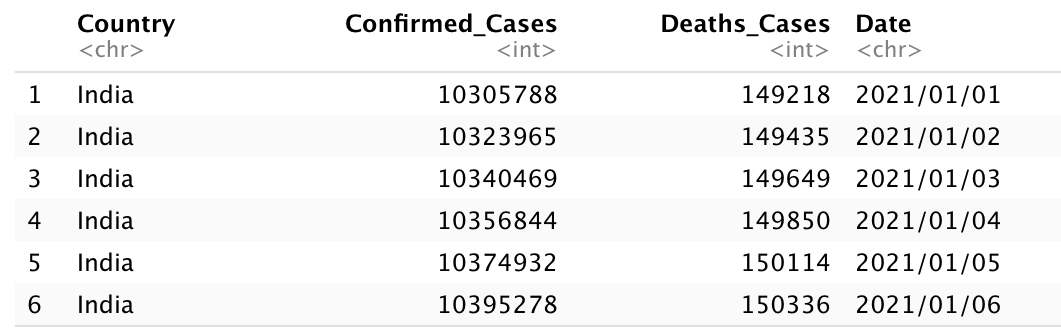
# Query the data set "India_Total" with the total COVID19 death cases for India from 2021/01/01 to 2021/12/31
India_death_data <-covid19_Country_Total("India","deaths","2021/01/01","2021/12/31")
# Combine the "India_Total" data and "India_death_data"
jointdataset <- join(India_Total, India_death_data, by=c("Date","Country"))
# change the Date to ""%Y/%m/%d""
china_Total$Date <- format(as.POSIXct(china_Total$Date,format="%Y-%m-%dT%H:%M:%SZ"),format="%Y/%m/%d")
India_Total$Date <- format(as.POSIXct(India_Total$Date,format="%Y-%m-%dT%H:%M:%SZ"),format="%Y/%m/%d")
jointdataset$Date <- format(as.POSIXct(jointdataset$Date,format="%Y-%m-%dT%H:%M:%SZ"),format="%Y/%m/%d")
# change column names of jointdataset
colnames(jointdataset)[2] <- "Confirmed_Cases"
colnames(jointdataset)[5] <- "Deaths_Cases"
# remove "Status" column of jointdataset
jointdataset<-jointdataset %>%
select(Country,Confirmed_Cases,Deaths_Cases,Date)
# View head of
head(china_Total)
head(India_Total)
head(jointdataset)
China_Total data
India_Total data
joindataset
Exploratory Data Analysis (EDA)
For EDA, I pull data from “By Country” endpoint, and “By Country Total” endpoint.
Create new columns
Create new columns named “Month” and “Cases_range” in “china_confirmed”, “china_total”, and “china_total” data :
# Create a new columns named "month" in "china_confirmed"
china_confirmed<-china_confirmed %>%
  mutate(month= month(ymd(china_confirmed$Date)))

# Create new columns named "month", "Daily_change", and "Daily_change_range" in "china_Total"
china_Total<-china_Total %>%
  mutate(month= month(ymd(china_Total$Date)))%>%
  mutate(Daily_change= Cases - lag(Cases))%>%
  mutate(Daily_change_range= cut(Daily_change, c(0, 75, 149,223,297, 373)))%>%group_by(Daily_change_range)
china_Total$month <- as.character(china_Total$month)

# Create three new columns named "month", "Daily_change", and "Daily_change_range" in "India_Total"
India_Total<-India_Total %>%
  mutate(month= month(ymd(India_Total$Date)))%>%
  mutate(Daily_change= Cases - lag(Cases))%>%
  mutate(Daily_change_range= cut(Daily_change, c(0, 82838,165675,248513,331351, 414189)))%>%group_by(Daily_change_range)
Create some contingency tables
Create a contingency table China_Total dataset: Daily_change_range v.s month
table(china_Total$Daily_change_range, china_Total$month)
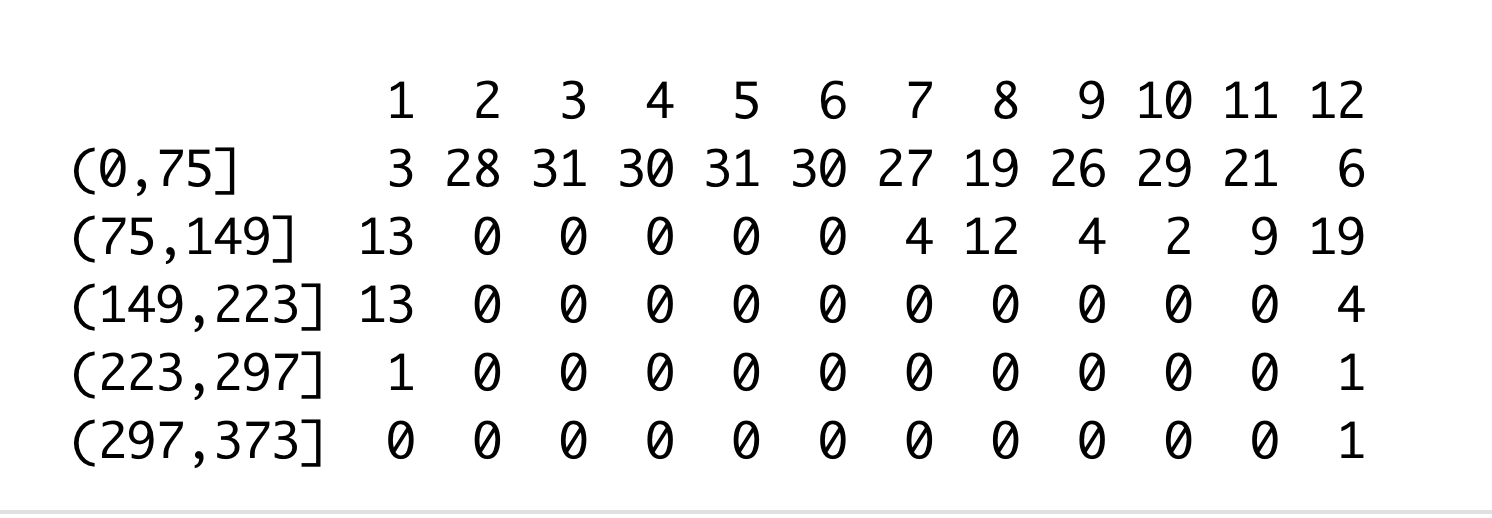
From above table, 3 means there are 3 days with confirmed covid-19 cases in range (0,75] in January in China.
As we can see, the most Daily_change confirmed cases in the lowest range (0,75], and the range (75,149] is just in January, July to December, and the other higher Daily_change_range of confirmed cases is just in January and December.
Create a contingency table India_Total dataset: Daily_change_range vs month
table(India_Total$Daily_change_range, India_Total$month)
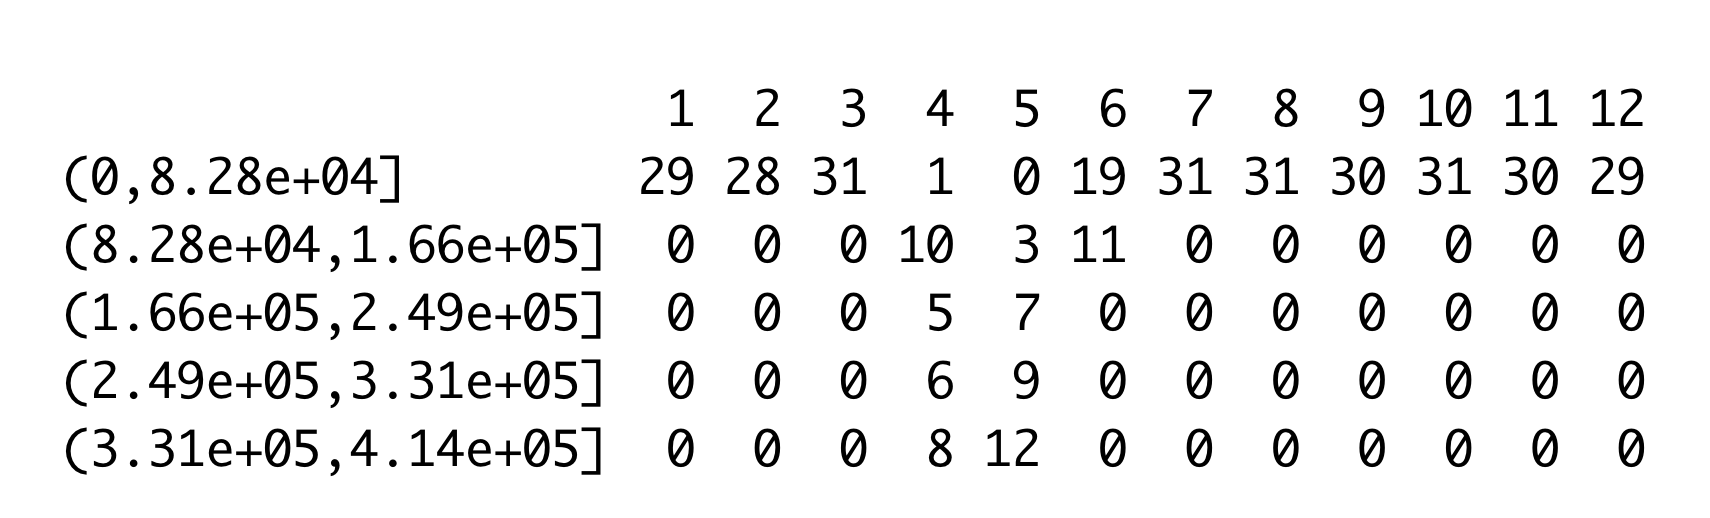
From above table, 28 means there are 28 days with confirmed cases in range (0,8.28e+04] in Feb 2021 in India.
As we can see, the most Daily_change confirmed cases in the lowest range (0,8.28e+04], and the other higher Daily_change_range of confirmed cases is almost in April and may.
Create numerical summaries
Create numerical summaries for “Daily_change” variable of china_Total
china_Total %>%
  drop_na(Daily_change)%>%
  group_by(month) %>%
  summarise(
          mean = mean(Daily_change)
            )
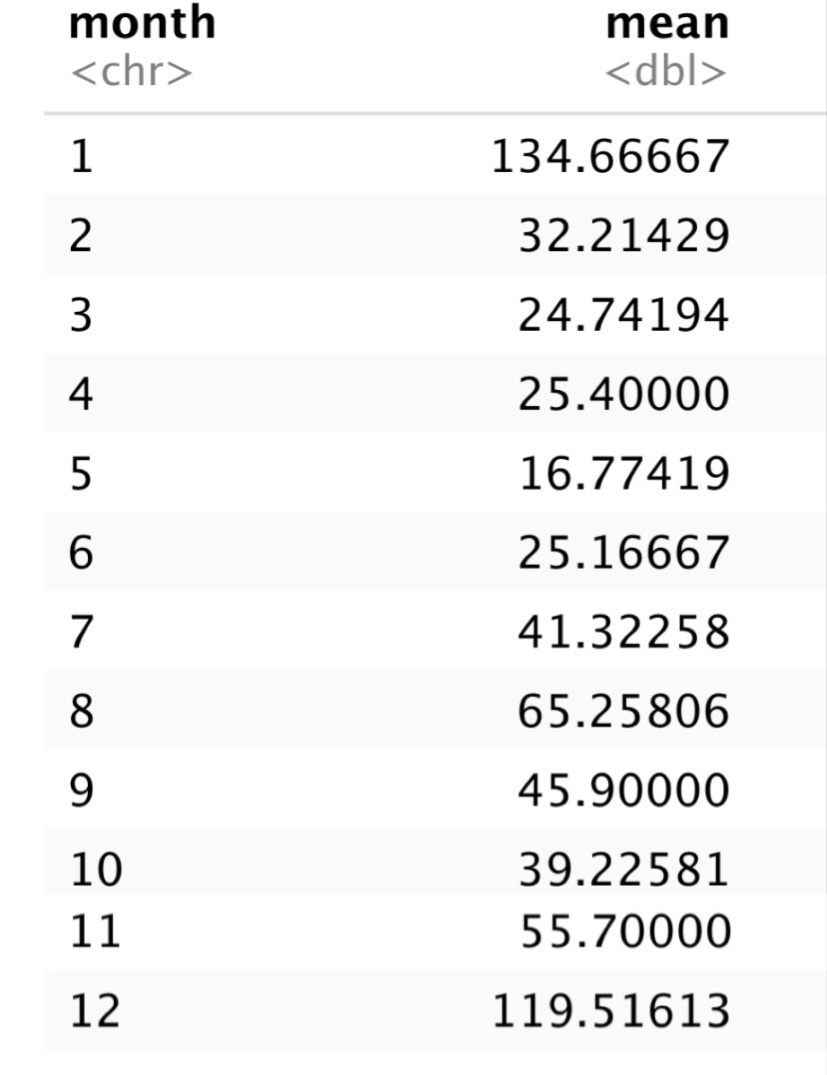
From the above table, the largest of the mean of Daily_change confirmed Covid-19 cases in 2021 China is 135 in January, and the smallest is 17 in May.
Create numerical summaries for “Daily_change” variable of India_Total
India_Total %>%
  drop_na(Daily_change)%>%
  group_by(month)%>%
  summarise(mean = mean(Daily_change)
  )
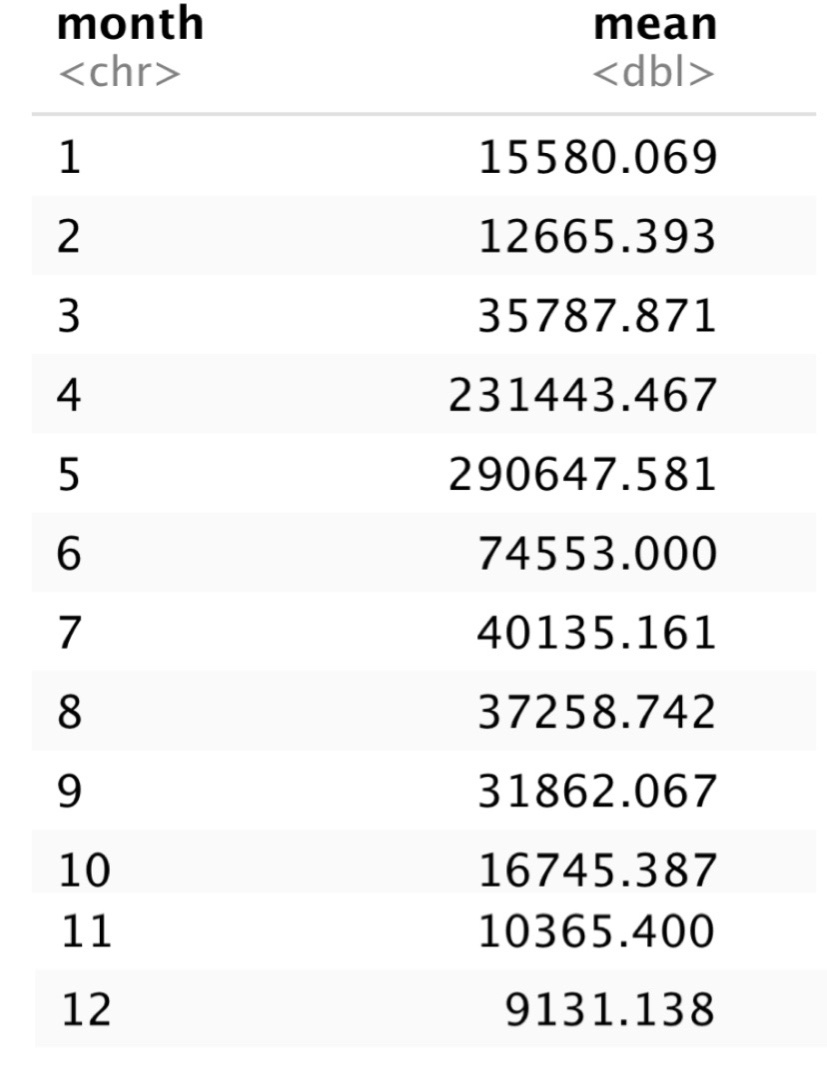
From the above table, the largest mean of Daily_change confirmed Covid-19 cases in 2021 India is 290648,and the smallest is 9131 in December.
Create plots
Create Bar Plot of Daily_Change Confirmed Covid19 Cases of China in 2021
china_Total <- china_Total %>% drop_na(Daily_change_range)
g <- ggplot(data = china_Total, aes(x = Daily_change_range))
g + geom_bar(color = "blue", fill = "blue")+
labs(title = "Bar Plot of Daily_Change \nConfirmed Covid19 Cases of China in 2021")
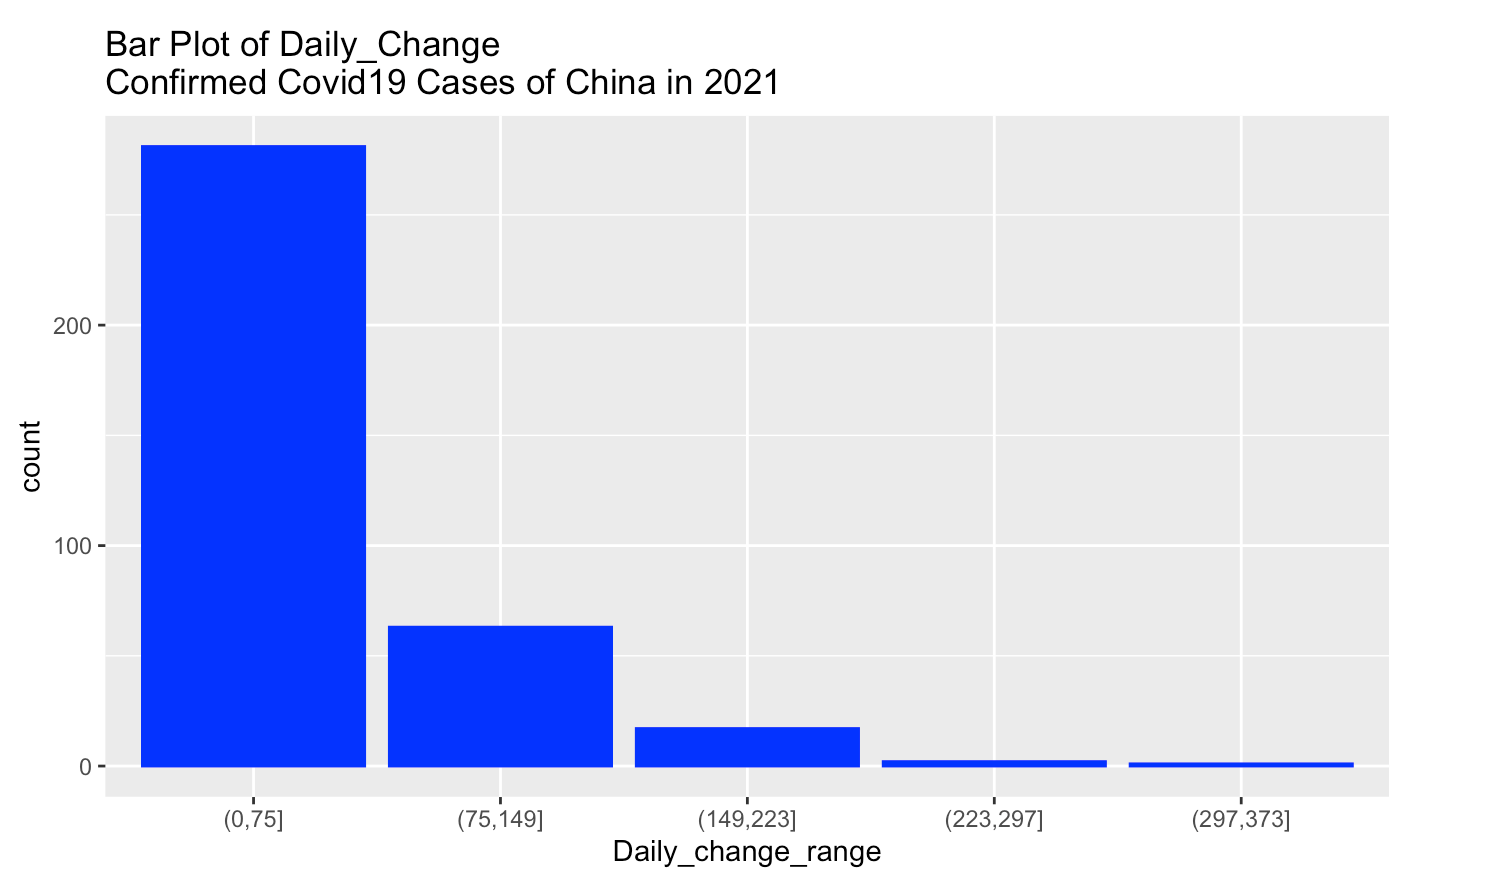
From above bar plot, the most Daily_change confirmed cases of China are in the range (0,75], and the least Daily_change confirmed cases of china are in the range (297,373]. It’s decreasing trend.
Create Bar Plot of Daily_Change Confirmed Covid19 Cases of India in 2021
India_Total <- India_Total %>% drop_na(Daily_change_range)
g <- ggplot(data = India_Total, aes(x = Daily_change_range))
g + geom_bar(color = "blue", fill = "blue")+
labs(title = "Bar Plot of Daily_Change \nConfirmed Covid19 Cases of India in 2021")+
theme(axis.text.x = element_text(angle = 45,size = 5))
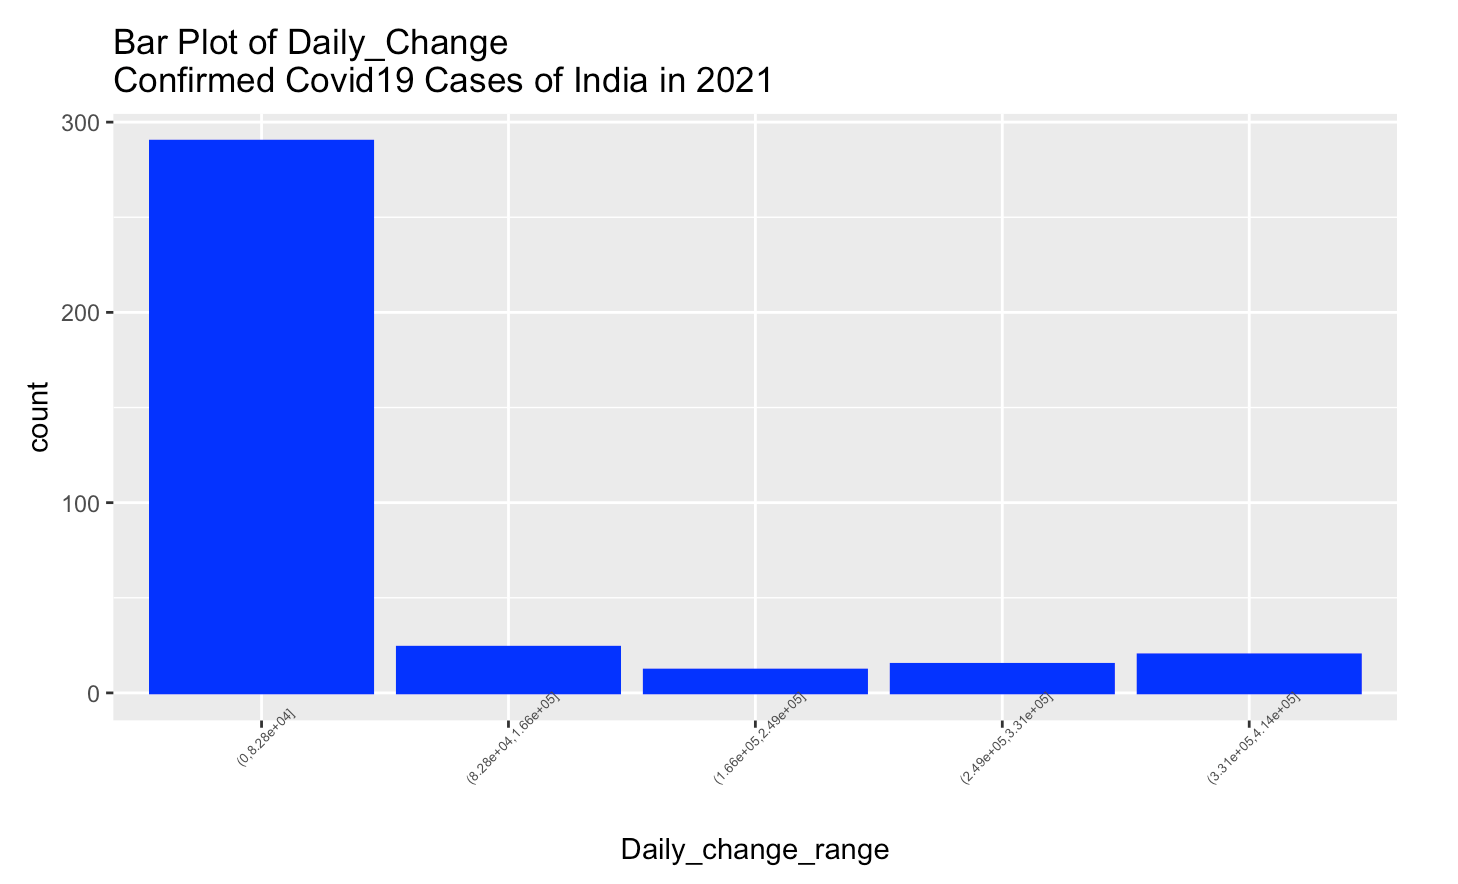
From above bar plot, the most Daily_change confirmed cases of India are in the range (0,8.28e+04], and the least Daily_change confirmed cases of India are in the range (1.66e+05,2.49e+05].
Create histogram of Daily_Change Confirmed Covid19 Cases of China in 2021
g <- ggplot(data = china_Total, aes(x = Daily_change))
g + geom_histogram(color = "blue", fill = "blue",
size = 2, binwidth = 3)+
labs(title = "Histogram of Daily_Change \nConfirmed Covid19 Cases of China in 2021")
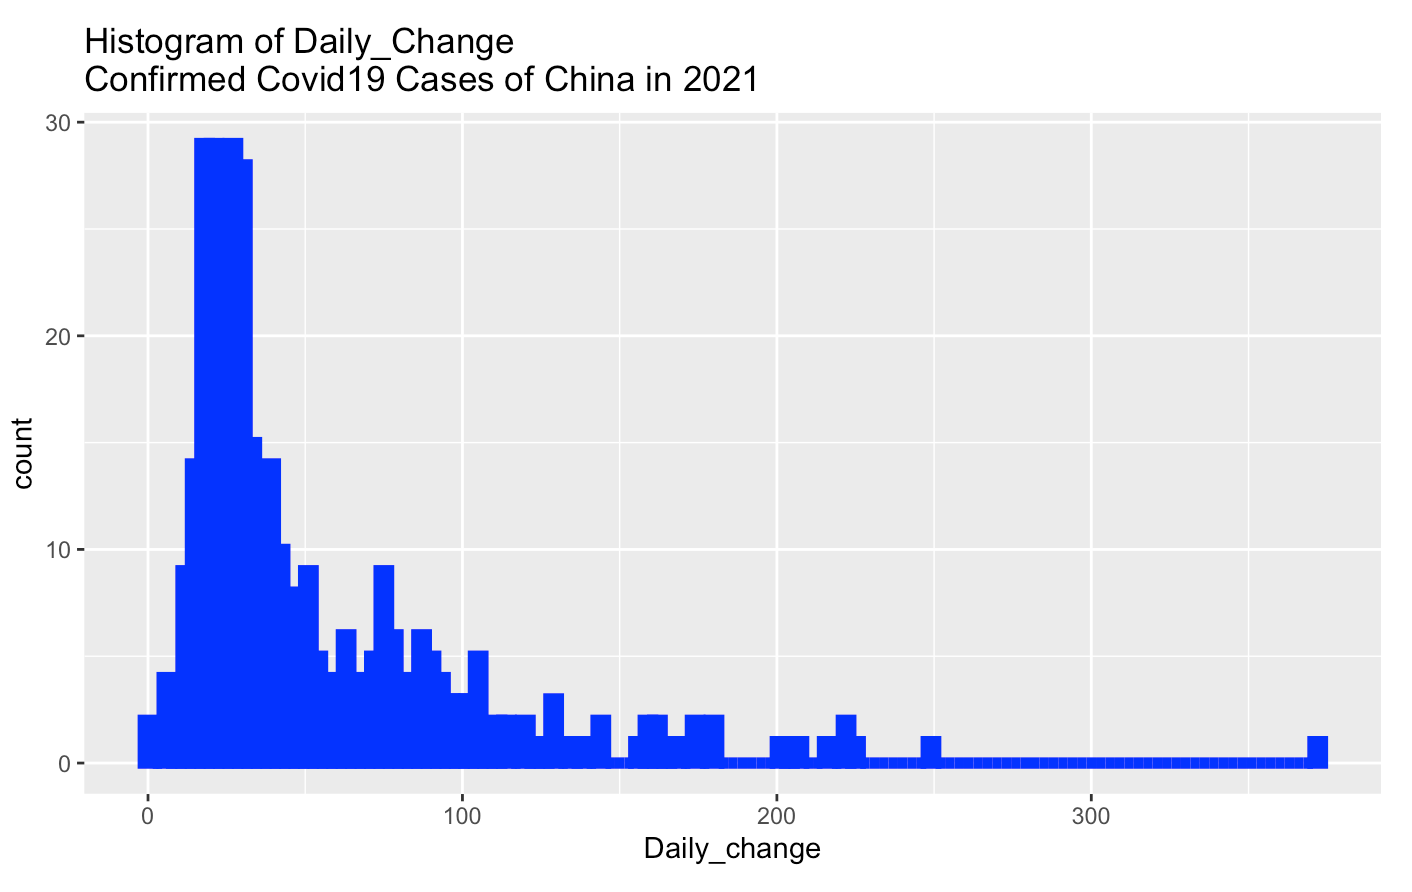
From above histogram, the most Daily_change confirmed cases of China are in the range (0,75].
Ceate Boxplot of Daily_Change Confirmed Covid19 Cases of Beijing and Shanghai in 2021
china_confirmed<-filter(china_confirmed, Province %in% c("Beijing","Shanghai"))
g <- ggplot(china_confirmed, aes(x = Province, y = Cases))
g + geom_boxplot(fill = "grey")+
labs(title = "Boxplot of Daily_Change \nConfirmed Covid19 Cases of Beijing and Shanghai in 2021")+
  stat_summary(fun = mean, geom = "line", lwd = 1.5, aes(group = month, col = month))
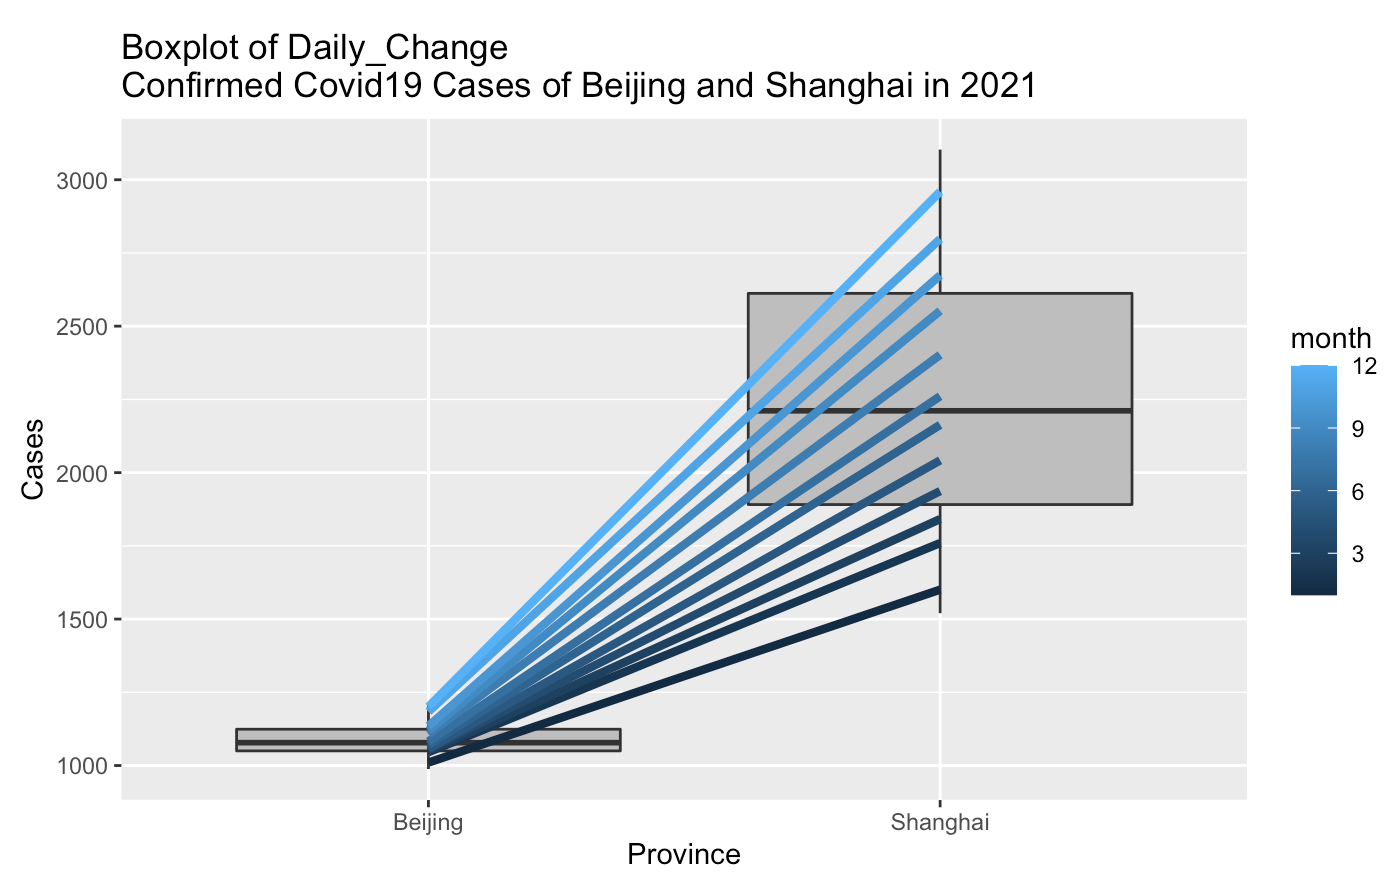
From above box plot, the Daily_Change Confirmed Covid19 Cases of Beijing is lower than Shanghai in 2021, and the slope of line with mean of Daily_Change Confirmed Covid_19 Cases of Beijing VS Shanghai grouped-by month is increased.
Create Scatter Plot of Confirmed_Cases Vs. Deaths_Cases of India in 2021
g <- ggplot(jointdataset, aes(x = Confirmed_Cases, y = Deaths_Cases))
g + geom_point(color="blue")+
  labs(title = "Scatter Plot of Confirmed_Cases \n Vs. Deaths_Cases of India in 2021")
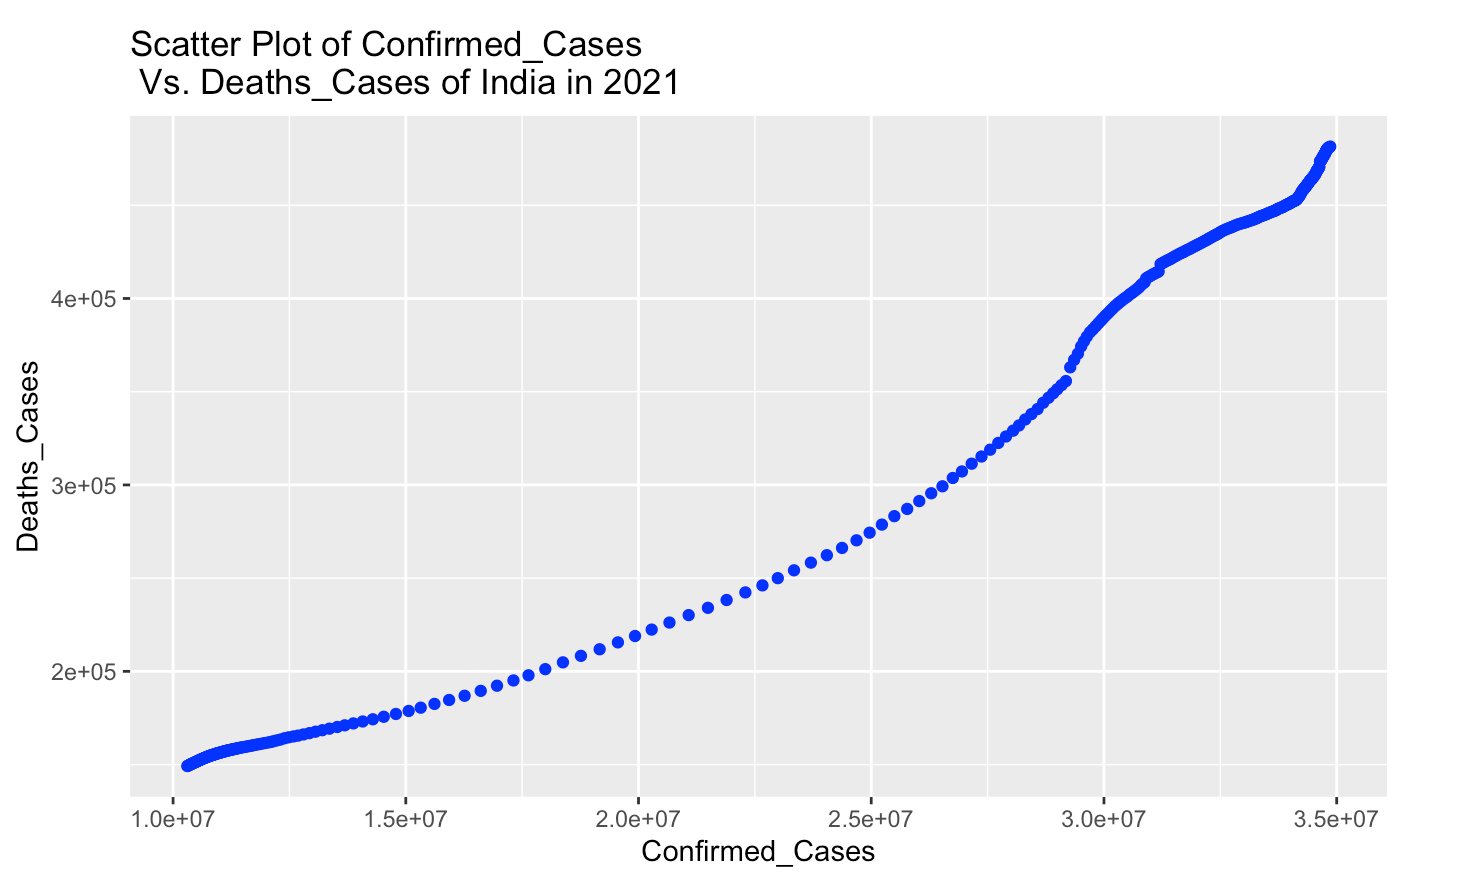
From above scatter plot, more confirmed_cases means more deaths_cases of India in 2021. This two variables are positive correlation.